
What is Graphy?
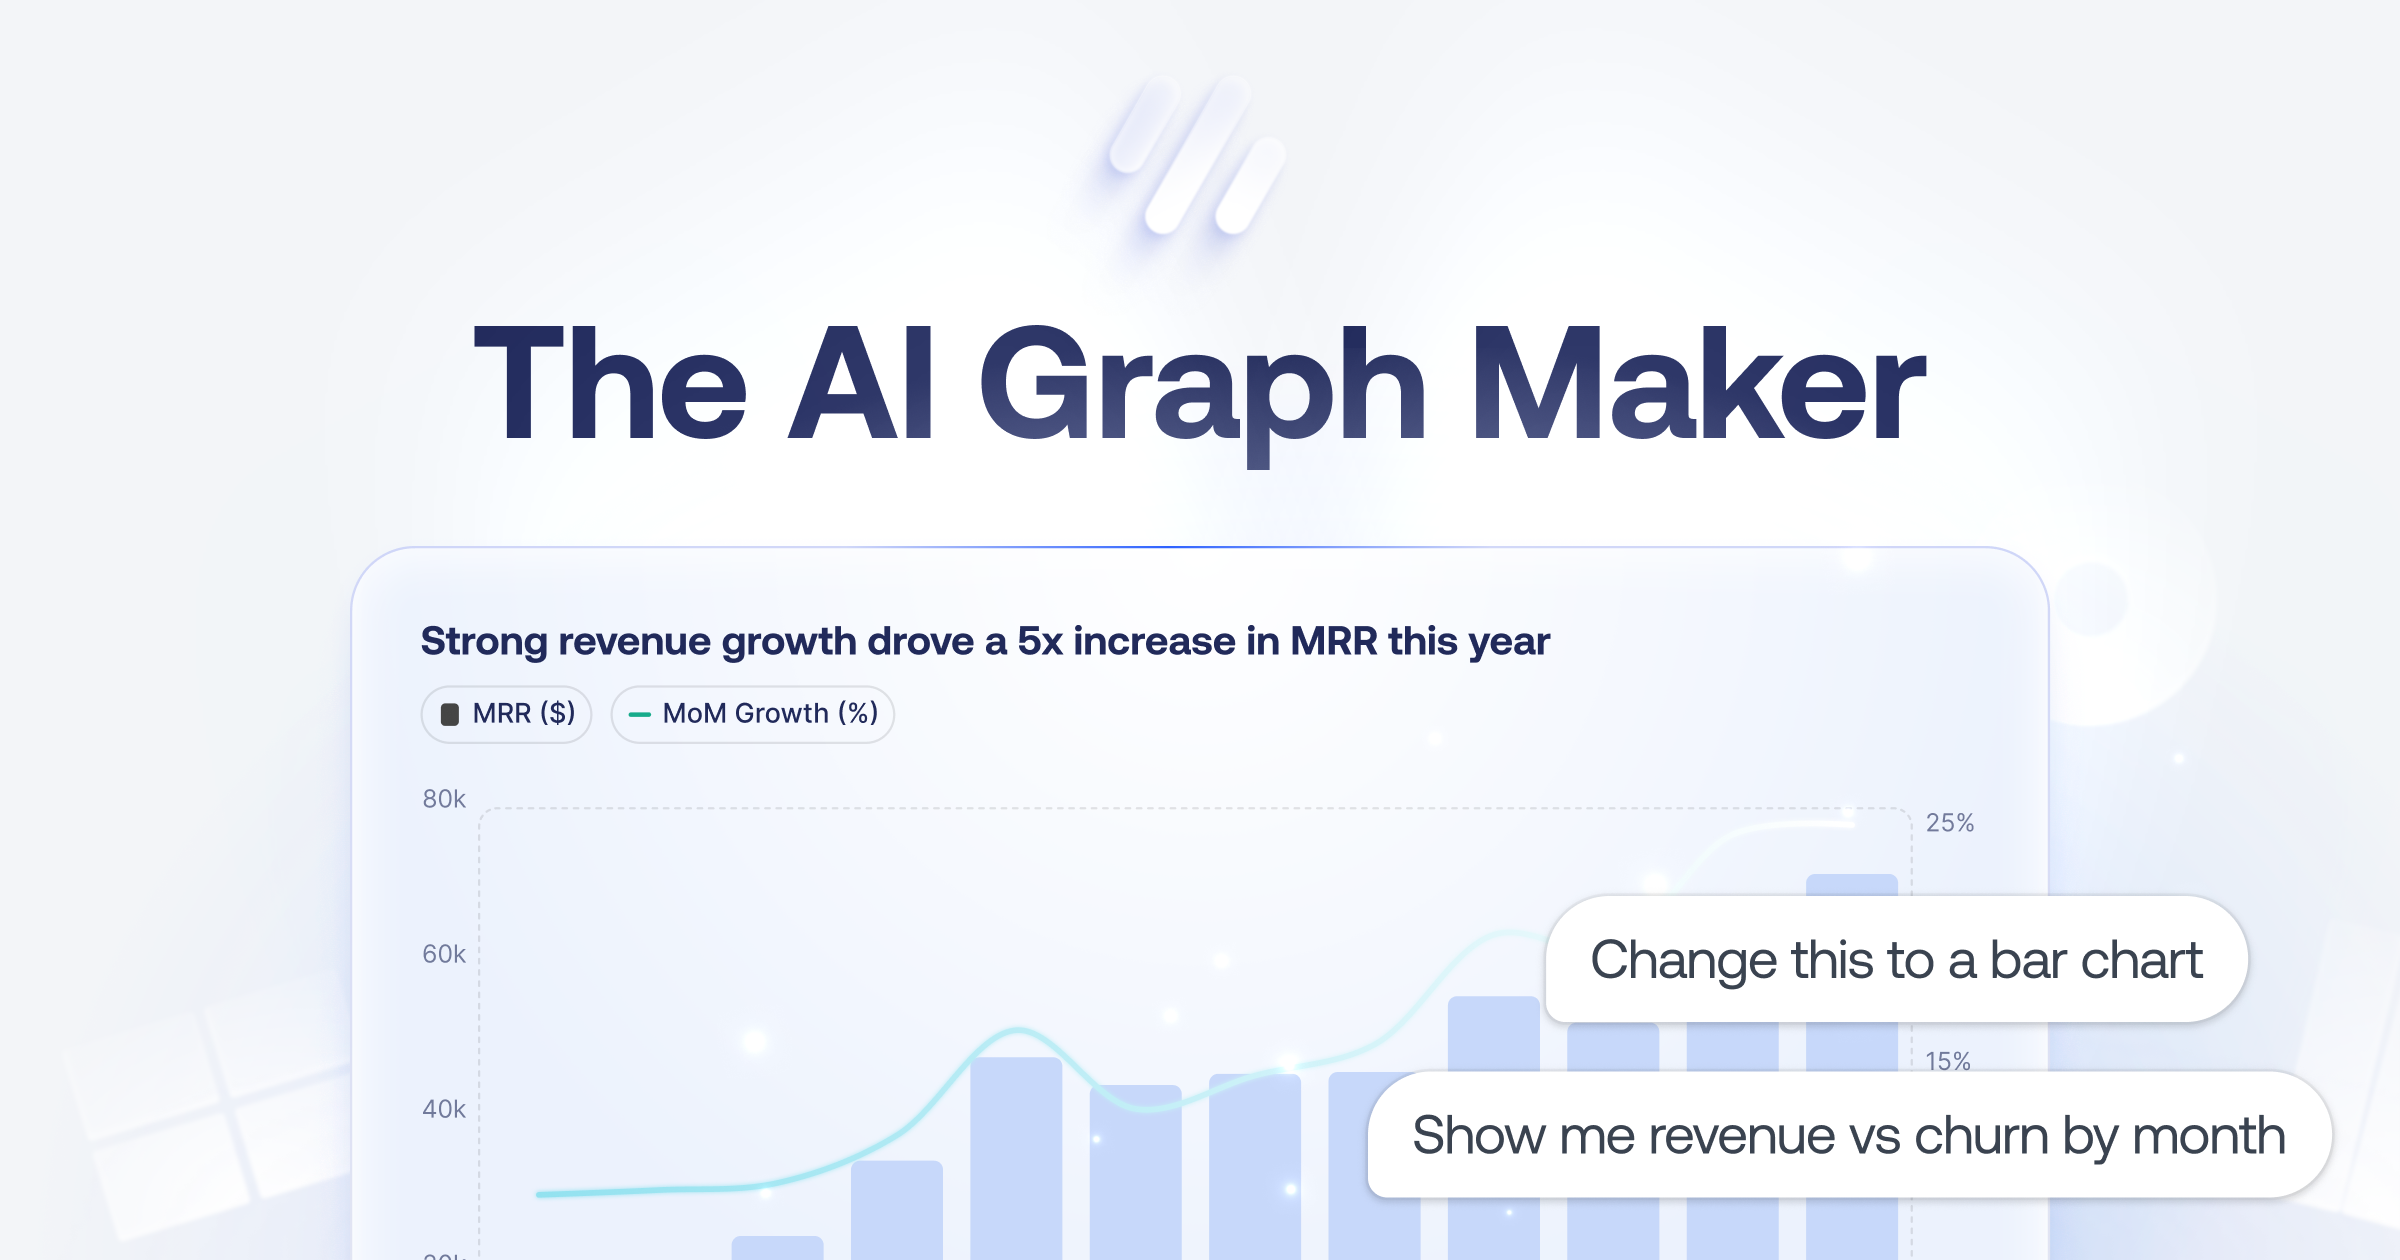
Graphy is a pioneering online tool designed to transform the way individuals and organizations present data through visually appealing graphs. By harnessing the power of artificial intelligence, Graphy simplifies data storytelling, making it accessible even to those with little to no background in data visualization. It effectively addresses common challenges in data presentation such as ambiguity, complexity, and time-consuming processes, enabling users to convert messy datasets into impactful visuals with minimal effort and maximum clarity.
The core workflow of Graphy revolves around a user-friendly approach to data input and visualization. Users can easily add their data through a variety of methods: linking a live Google Sheet, uploading a CSV or Excel file, or simply pasting their values into the platform. Notably, Graphy does not require any prior data preparation or formatting, allowing users to bypass often tedious preliminary steps. Once the data is uploaded, the platform’s AI engine takes over. It meticulously inspects each row of data, generating three clear and insightful charts that highlight key findings, along with understandable headline takeaways. Additionally, users are invited to engage in conversation with their data, asking the AI to provide specific insights, thus fostering a more interactive experience.
Graphy’s standout features include its ability to brand all charts instantly. Users can customize graphs by applying their preferred colors and fonts, which strengthens brand identity while enhancing the aesthetics of presentations. Further, Graphy offers versatile options for sharing insights, whether through export capabilities for documents and slides or embedded options for social media posts. This versatility ensures that important data is not only analyzed but communicated effectively, whether in formal settings or casual contexts.
The target audience for Graphy spans a broad spectrum, including marketing professionals, data analysts, executives, and anyone else looking to convey insights from data efficiently. Common use cases involve constructing visually appealing charts for newsletters, social media campaigns, internal team reports, or presentations to stakeholders. Users from various fields find Graphy indispensable for creating stunning visuals without the hassle associated with traditional tools like Excel.
In the landscape of data visualization tools, Graphy stands out due to its integration of AI capabilities, simplifying the process to an unprecedented degree. Competitors may offer similar functionalities but often demand more complex operations or extensive manual interventions. With Graphy's intuitive design and automated processes, users can significantly reduce the time spent on creating visuals while ensuring high-quality outputs. However, it's worth noting that while the tool is exceptionally powerful, it may still have limitations concerning more intricate data manipulations, which may require users to possess a foundational understanding of data analysis principles.
While Graphy excels in many areas, it is important to consider some limitations as well. Users whose data requires extensive customization beyond the platform's generative capabilities may find they need supplementary resources or tools to achieve their desired outcome. Additionally, as with any AI-driven platform, reliance on automation can lead to unexpected findings if users do not critically evaluate the AI’s recommendations. Furthermore, there could be variations in support for different graph types or particular data formats, which users should be aware of as they begin utilizing the platform.
Who it's for
Works with
What Graphy can do
8 capabilities, verified from the product.
- Instantly create beautiful graphs
- Integrate with Google Sheets
- Upload CSV or Excel files
- Customizable colors and fonts
- AI-powered insights generation
- Export charts for presentations
- Embed charts into social media
- Real-time data updates
Jobs people hire it for
- 01Generate clear visual reports from sales data
- 02Create custom charts for marketing campaigns
- 03Enhance presentations with impactful visuals
- 04Share insights directly on social media
- 05Develop internal reports for team meetings
Pros & cons
Where it shines
- User-friendly interface suitable for all skill levels
- AI integration simplifies the data analysis process
- Fast generation of graphs from various data sources
- Customization options enhance brand visibility
Where it falls short
- Limited advanced customization options
- Initial learning curve for new users
- May not support all data formats perfectly
Pricing
Free access with premium features in development. Pricing can change — always confirm on the vendor's site.
Frequently asked about Graphy
What features does Graphy offer?
Graphy allows users to quickly create beautiful graphs by integrating with Google Sheets, uploading various file formats, and utilizing AI to generate insights. It supports customization with branding options, export capabilities for presentations, and embedding charts into social media posts.
How does the data input process work?
Users can add their data by linking a live Google Sheet, uploading a CSV or Excel file, pasting values directly into Graphy, or even using an API. The platform automatically ingests the data without the need for prior formatting.
Is there a cost associated with using Graphy?
Graphy offers a free tier for users, with premium features available for enterprise-level needs being explored in future developments.
Who is Graphy designed for?
Graphy is crafted for a wide range of users including marketing professionals, data analysts, and executives who need to visualize data quickly and effectively. It's beneficial for anyone looking to enhance their data storytelling capabilities.
What are the advantages of using AI in Graphy?
The AI in Graphy significantly enhances the user experience by rapidly analyzing data and generating meaningful insights through graphical representations, which simplifies data interpretation and communication.
Can I customize the graphs created in Graphy?
Yes, users can instantly apply their brand's colors and fonts to charts, allowing for a cohesive look that enhances brand identity across all visuals.
How does Graphy compare with other data visualization tools?
Graphy distinguishes itself with its speed and ease of use, especially with AI capabilities that streamline data processing and visual output, making it more accessible than many traditional tools.
What limitations should I be aware of?
While Graphy is a powerful tool, it may not cater to all complex data manipulation needs and relies on user critical evaluation of AI-generated insights.
Ready to try Graphy?
1,643 people checked it out on the directory — see it in action on the official site.
Keep exploring
Similar tools in Data & Analytics
 Data & Analytics
Unlearn
Streamlining clinical trials with AI and digital twins of patients.
 Data & Analytics
ora
Evaluate your business's readiness for AI agents across multiple layers.
 Data & Analytics
crawler.sh
Local Markdown Extractor for AI Training and RAG
 Data & Analytics
Gong Revenue AI OS
AI-powered platform for enhancing sales team efficiency and effectiveness.